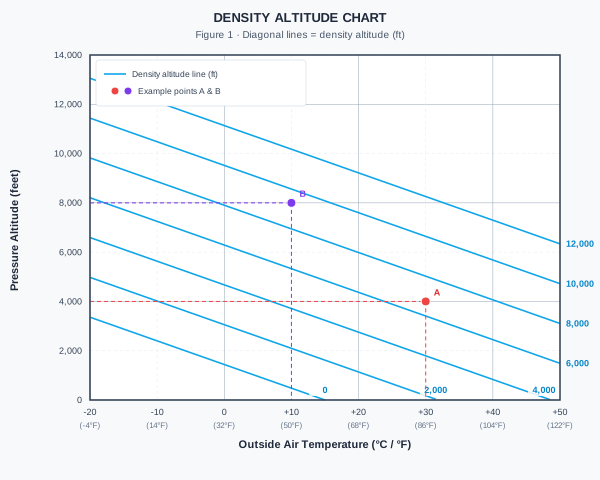
On the density altitude chart in Figure 1, the diagonal lines slanting across the chart area represent: