← WeatherWeather · 118 / 119
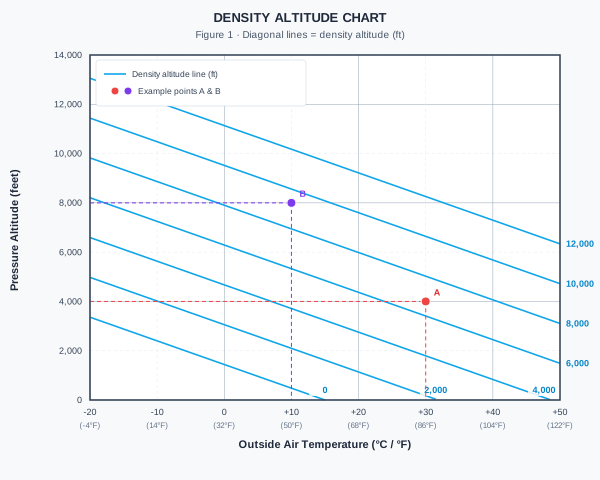
Refer to Figure 1. At a pressure altitude of 8,000 ft and an OAT of +10°C (Point B on the chart), the density altitude is approximately:
Refer to Figure 1. At a pressure altitude of 8,000 ft and an OAT of +10°C (Point B on the chart), the density altitude is approximately: